COP29 Flops as Starmer Makes UK Cop for the Lot
As COP29 ends with a weaker deal than planned, the Government commits the UK to a damaging 81% emissions cut by 2035
Introduction
COP29 is widely thought to have been a waste of time, effort and money. At the time of final edit at 22:45 UK time on Saturday 23rd November, the COP negotiations are >32 hours over time as nations clashed over whether public climate funding should be increased from $100bn/year to around $300bn/year, somewhat down on the original ask of $1,000-1,300bn per year. Apparently, the $300bn/year has now been agreed, but there are dissenting voices, such as India. The squabble came even as the world is forecast to have already breached the sacred 1.5C limit without anyone noticing apart from a few alarmists.
In an illustration of how how obsolete these meetings are, Keir Starmer was the only major world leader to attend the Baku jamboree with the leaders of countries responsible for 70% of emissions staying away. The leaders of Brazil, China, EU, France, Germany, India, Indonesia, Japan and the US all declined to attend. Javier Milei of Argentina even ordered his delegation to return home after three days.
The G20 underlined the futility of it all by failing to back a call to repeat last year’s COP28 pledge to transition away from fossil fuels. The BBC’s Climate Editor, Justin Rowlatt made us realise that the COP process is a gangrenous limb in desperate need of amputation when he called for us to “forget climate, COP is really about cash.” When even the Guardian is reporting that COP summits are no longer fit for purpose, you realise the gangrene has spread and COP has been dead a while, now a fetid corpse awaiting burial.
You have to wonder why the UK bothered to send 470 delegates to COP29. It is even more bizarre to see Prime Minister Starmer committing to an 81% emissions cut from 1990 levels by 2035 just as the Global Carbon Budget (GCB) project released new figures showing global emissions rising to a new record level in 2023. Starmer’s announcement followed the advice of the Climate Change Committee (CCC) who claimed their guidance was informed by “the latest science, technological developments and the UK’s national circumstances.”
With this backdrop, it is worth reminding ourselves about the trajectory of global emissions and energy use, the UK’s tiny contribution as well as the serious impact Net Zero policies are having on our economy.
Global CO2 Emissions Trajectory Undermines COP Promises
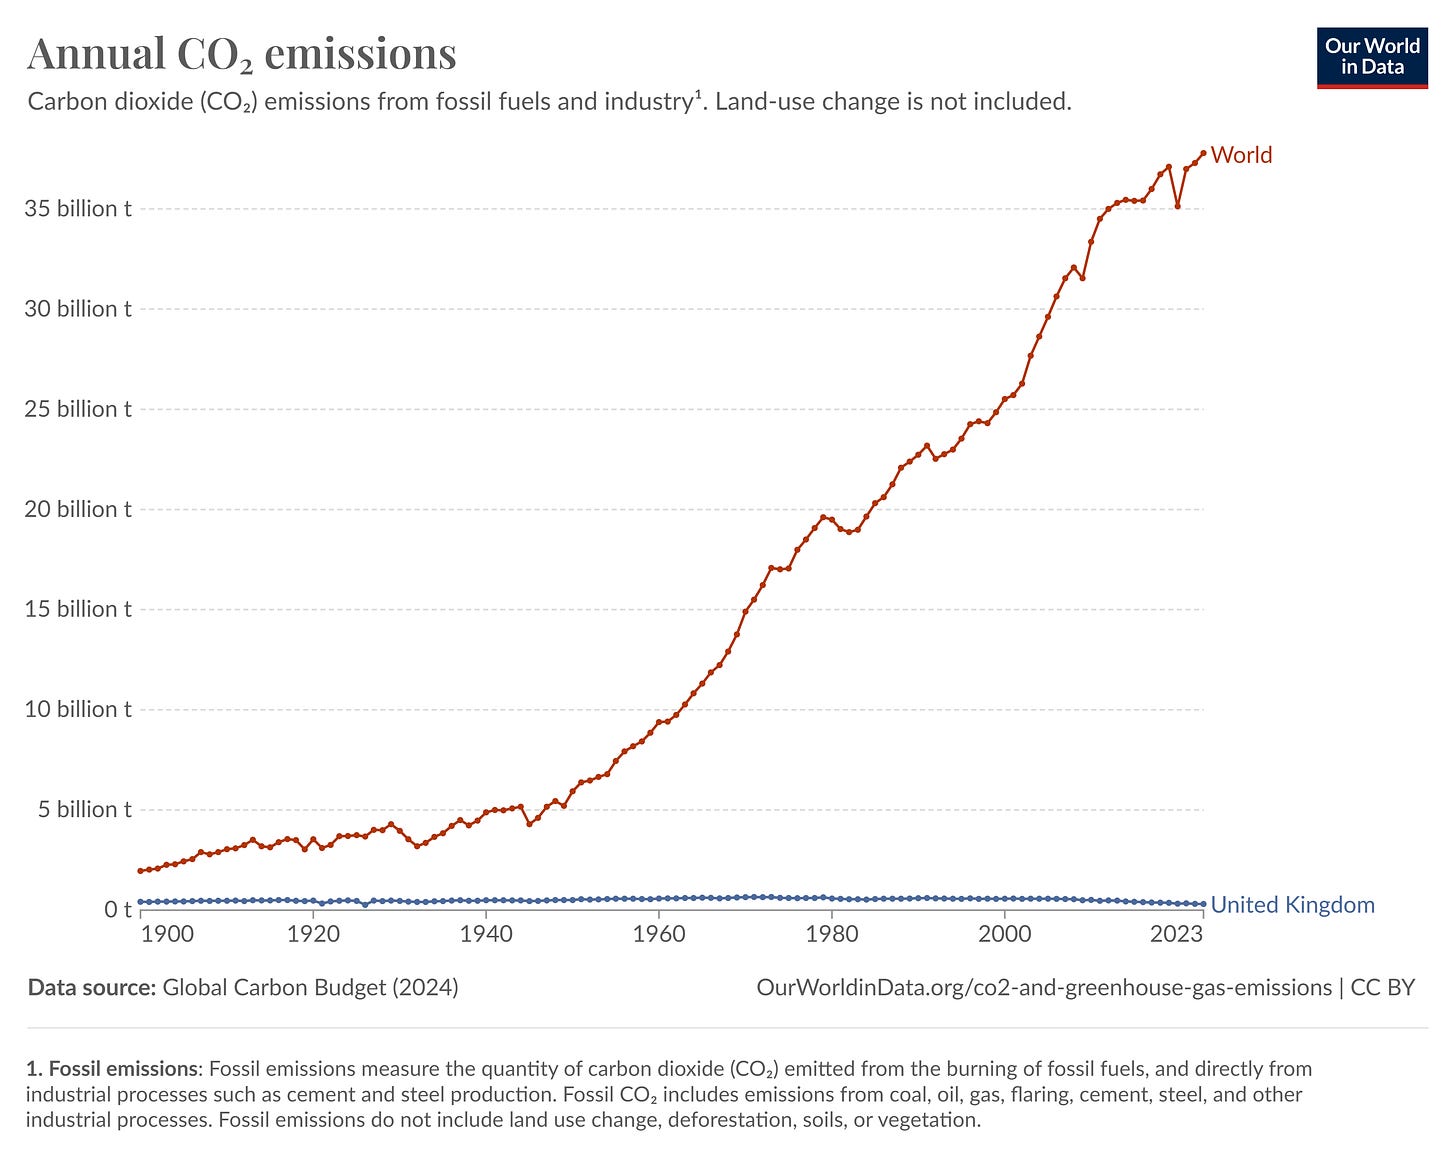
Our World in Data (OWID) have created a helpful chart from the GCB data as shown in Figure 1.
As global emissions have soared off the chart, the UK’s have fallen to a tiny fraction of the global total. The $100bn/year has clearly made no difference to emissions and there is no sign that the extra funding they are arguing about will make any difference either. While global leaders might once have paid lip service at the various COP meetings, their actions speak louder than their words. Now they cannot even be bothered to attend and mouth platitudes at each other.
Looking more closely at the Global Carbon Budget data (which do not quite match the OWID chart) we can see that global emissions from fossil fuels have risen by 494m tonnes CO2 to a new record of 37,614m tonnes. UK emissions of 305.1m tonnes fell 8.7m tonnes from 2022 and now represent just 0.81% of the global total, little more than a rounding error. Global emissions went up more than our total emissions. If we were to cut our emissions to zero, the rest of the world would replace them within a few months.
Looking a bit deeper, we can calculate that since 1850, the first year of GCB records, the UK has emitted just 4.2% of the global total with the US on 23.9%, the EU27 on 16.5% and China on 15.1%.
UK emissions are now lower than at any time since the General Strike of 1926. We have to go back to 1880 to find a year when UK emissions were lower than 2023 for a sustained period. To achieve the Starmer target of an 81% reduction in emissions compared to 1990 levels, they would have to fall to a level lower than in 1850. UK emissions would then represent just 0.3% of the global total for 2023.
UK CO2 Emissions per Capita Below Global Average
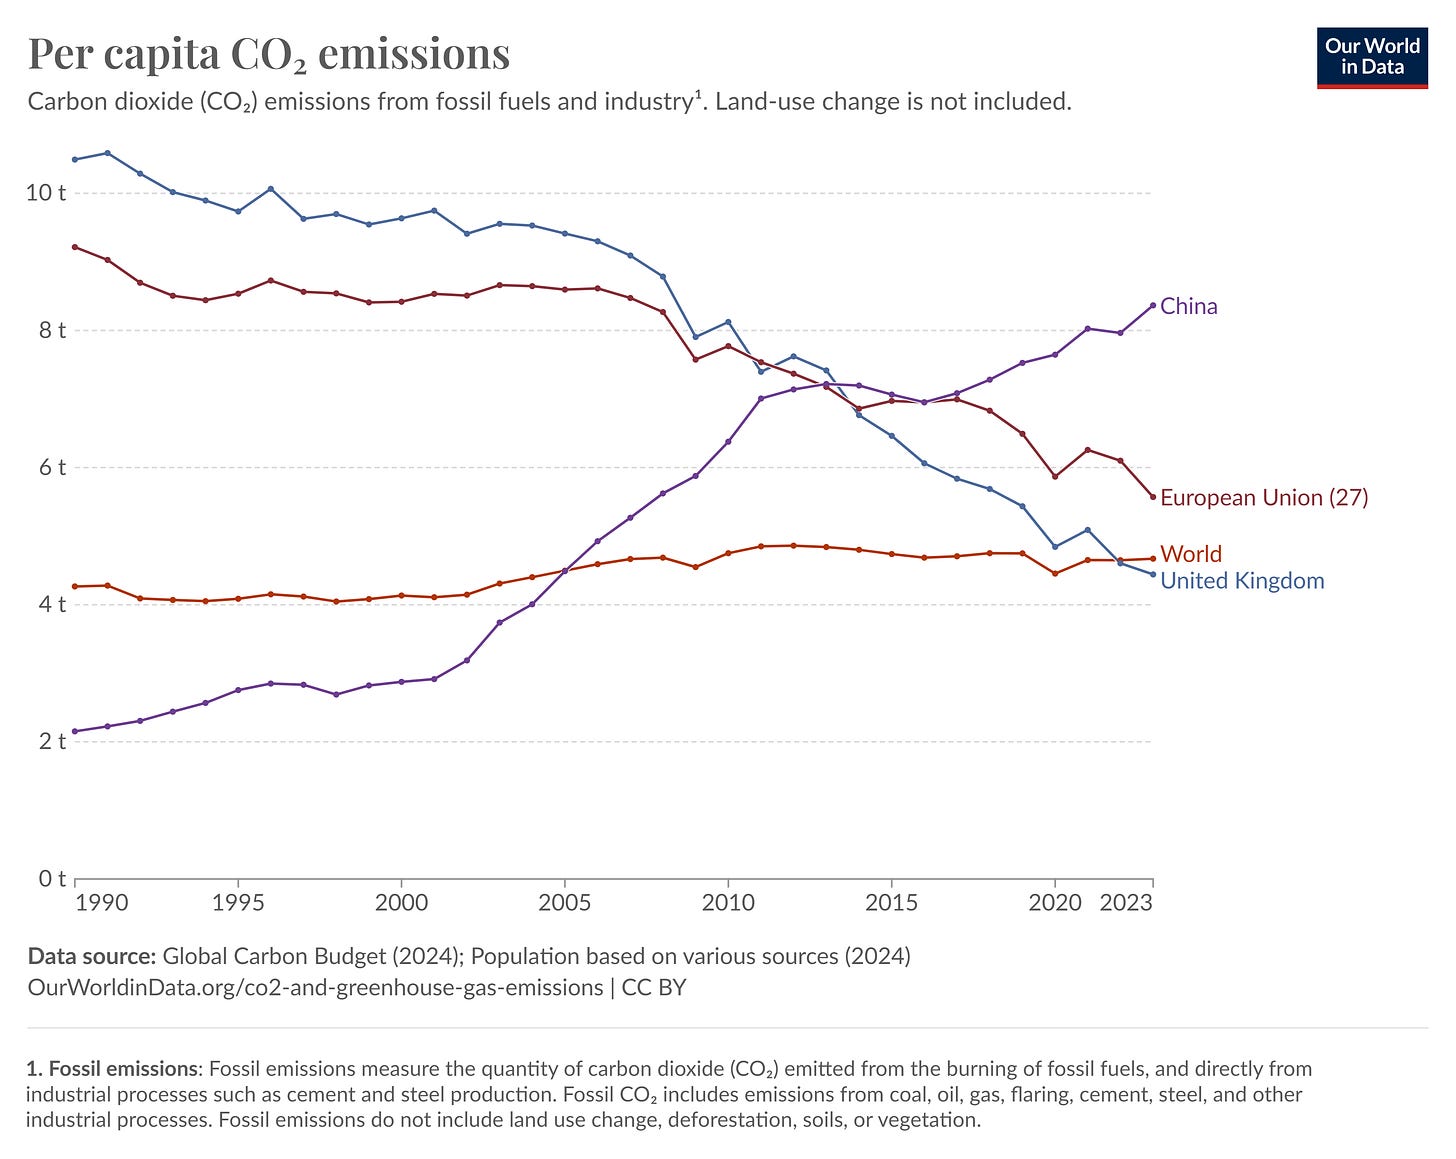
OWID have also created another useful chart showing per capita emissions as shown in Figure 2.
UK emissions on a per capita basis are little more than half those of China, less than the EU27 and now lower than the world average. In 1990 our per capita emissions were more than double the world average.
Ed Miliband claims that the UK is showing “international leadership in tackling the climate crisis.” But you can only lead if others follow and the rest of the world is clearly not following our energy and emissions self-flagellation. As we shall see below, we are world leaders in impoverishing ourselves while the rest of the world goes in the opposite direction.
Global Energy Use is Soaring as Backdrop to COP29
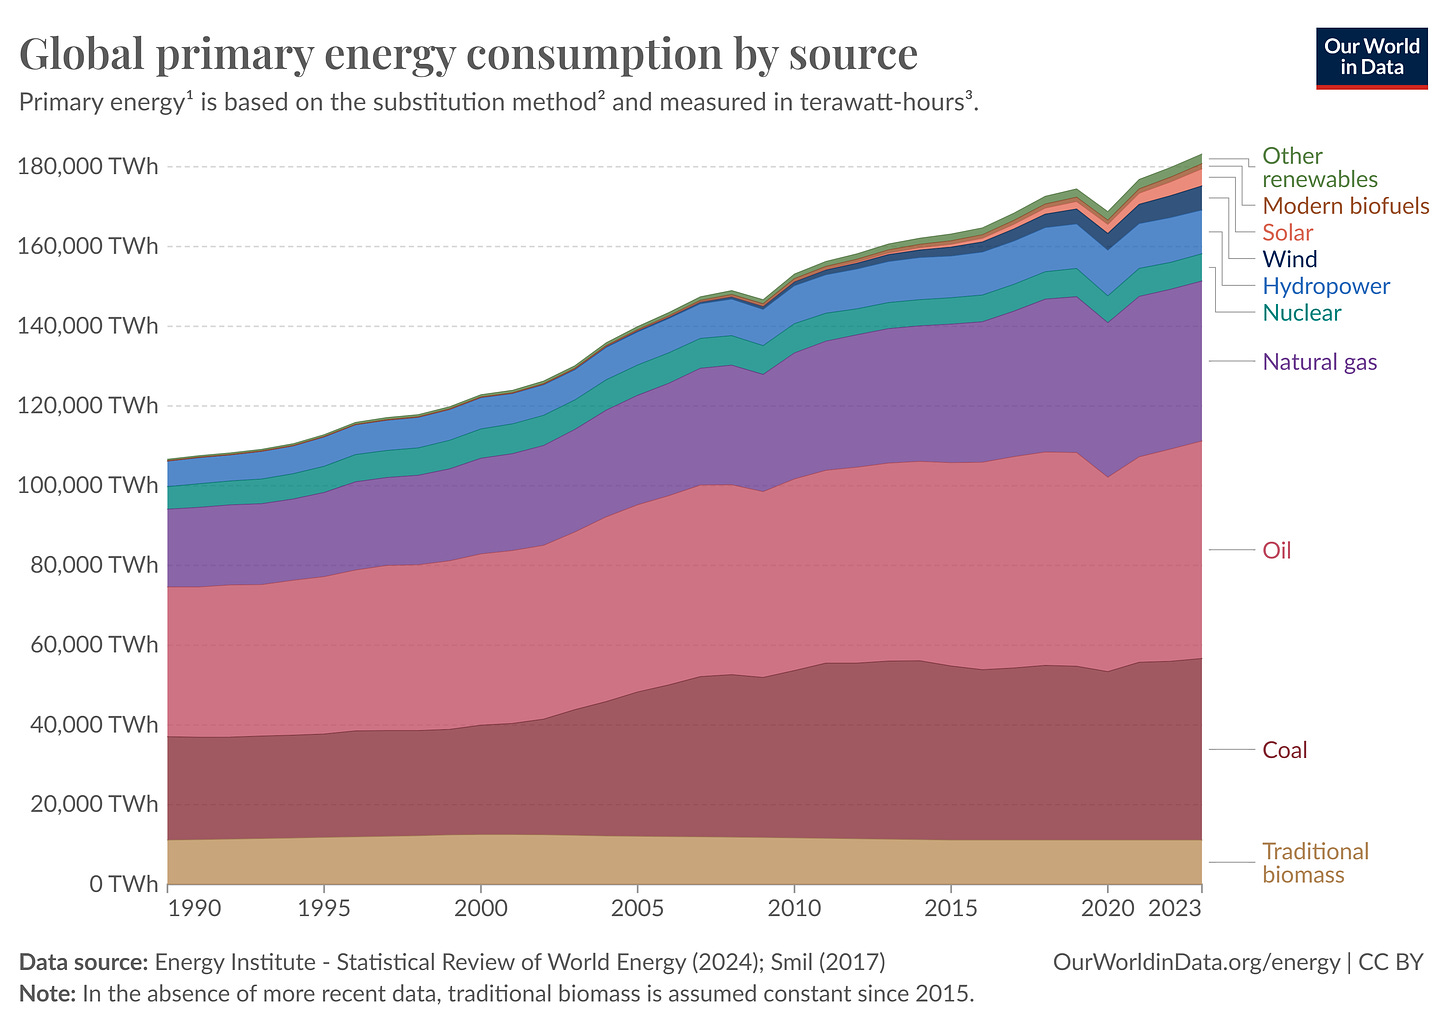
During the COP29 meeting Ed Miliband also claimed there’s a “global clean energy revolution” underway and that it is “unstoppable.” In the light of this, we should examine global energy consumption, again from OWID as shown in Figure 3.
Note this chart uses the “substitution method” to correct for efficiency losses when burning fossil fuels. In effect, non-hydrocarbon sources are scaled up by a factor of ~2.5 to give an equivalent input energy to coal, oil and gas. The chart shows the change in primary energy use since 1990 which is the reference year for emissions reduction targets.
It is interesting to observe that global total energy consumption has risen from 106,656TWh to 183,230TWh in 2023. The total energy from coal, gas and oil has risen from 83,005TWh to 140,231TWh. The individual amounts of coal, oil and gas consumed in 2023, and of course the combined total, were all at record highs in 2023. There is no sign of fossil fuel consumption falling. However, the proportion of energy derived from fossil fuels has fallen slightly from 77.8% in 1990 to 76.5% in 2023. More than three quarters of global primary energy still comes from fossil fuels and for all the efforts of the COP meetings, total consumption is still rising.
Nuclear power has increased in absolute terms from 5,677TWh to 6,824TWh, but has fallen as a proportion from 5.3% to 3.7%. Wind and solar have risen from 19TWh (0.0%) to 10,305TWh (5.6%) in 2023. Hydro, biofuels and other renewables have risen from 6,851TWh (6.4%) in 1990 to 14,760TWh (8.1%) in 2023. Although the estimates of traditional biomass have fluctuated in absolute terms over the period, the energy from that source has stayed flat at 11,111TWh while the share has fallen from 10.4% to 6.1%.
There is precious little sign that Miliband’s energy revolution is taking place. Overall energy use is going up and fossil fuel consumption is at record highs. The share of energy from fossil fuels is down very slightly but overall consumption is up 68.9% from 1990 levels. Although the absolute amount of energy generated from renewables of all types (wind, solar, hydro, biofuels and other) is up sharply by 18,202TWh (265%) since 1990, the increase is less than a quarter of the overall energy growth. The growth in renewables from 2022 to 2023 (1,243TWh) is only a little over a third of the increase in overall energy consumption (3,411TWh). It is clear that renewables are not keeping up with global energy demand.
UK Energy Consumption Falling Rapidly
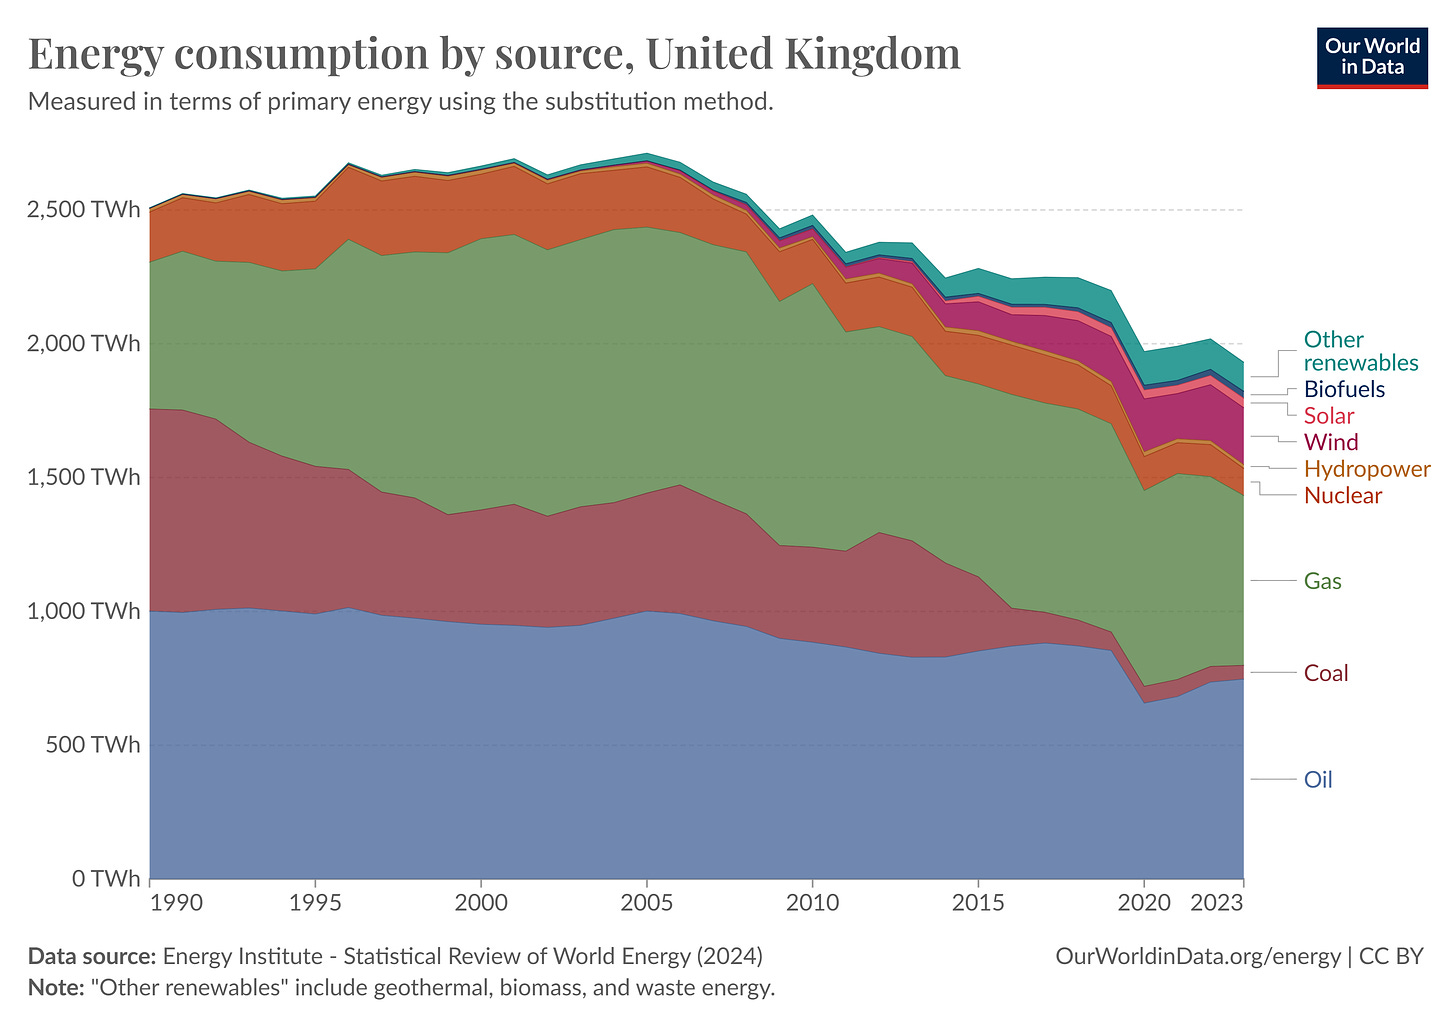
If we now zoom in on the UK, as in Figure 4, we see a very different picture.
The UK’s overall energy consumption grew slightly from 1990 before peaking in 2005. Since then, there has been a steady downwards trend so now consumption is only 1,931TWh some 23% lower than in 1990. Total energy consumption is lower than any year since the OWID records began in 1965.
The total energy from coal, gas and oil has fallen from 2,305TWh to 1,433TWh. The proportion of energy derived from fossil fuels has fallen by 17.7% from 91.9% in 1990 to 74.2% in 2023. Fifteen years after the energy purgatory imposed upon us by the Climate Change Act, we still derive nearly three quarters of our total energy from hydrocarbons.
Nuclear power has decreased in both absolute terms from 187TWh to 102TWh and the proportion from 7.4% to 5.3%. Wind and solar have soared from nothing in 1990 to 249TWh (12.9%) in 2023. Hydro, biofuels and other renewables (including burning trees for electricity) have risen sharply from 17TWh (0.7%) in 1990 to 147TWh (7.6%) in 2023.
We are not so much transitioning from fossil fuels as moving away from energy altogether, which is having a devastating effect on the economy.
Impact of UK Energy Policy on the Economy
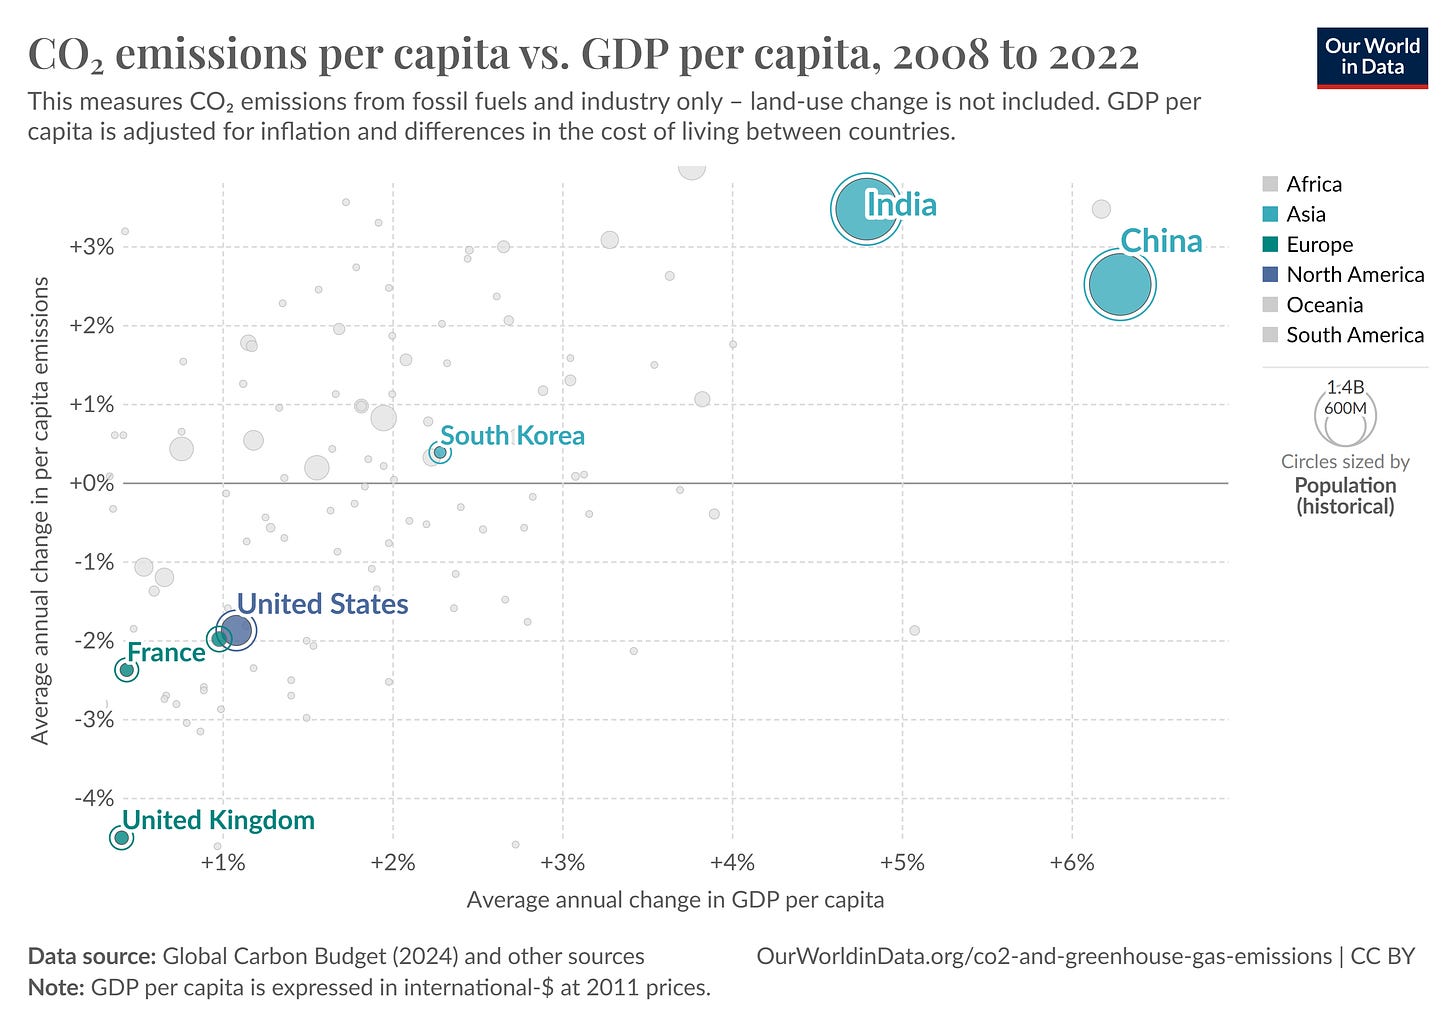
OWID also publishes data that allows us to see the impact of emissions reduction and energy scarcity on the economy. First, we can see the relationship between emissions reduction and economic growth per capita as shown in Figure 5 (data from OWID here).
In this chart, France and Germany have been used as a proxy for the EU27 because OWID does not aggregate EU27 data for this particular chart. Germany is the small turquoise dot emerging from the bottom left of the United States. The message is stark, the more emissions are reduced, the slower the growth. Emerging nations such as Korea, India and China have grown quickly as their emissions have grown. The West, epitomised by the UK, France, Germany and even the US have cut emissions and grown much more slowly. The UK, having shown “climate leadership” by cutting emissions more than any other large country other than Ukraine (which is at war), has shown feeble growth in GDP per capita.
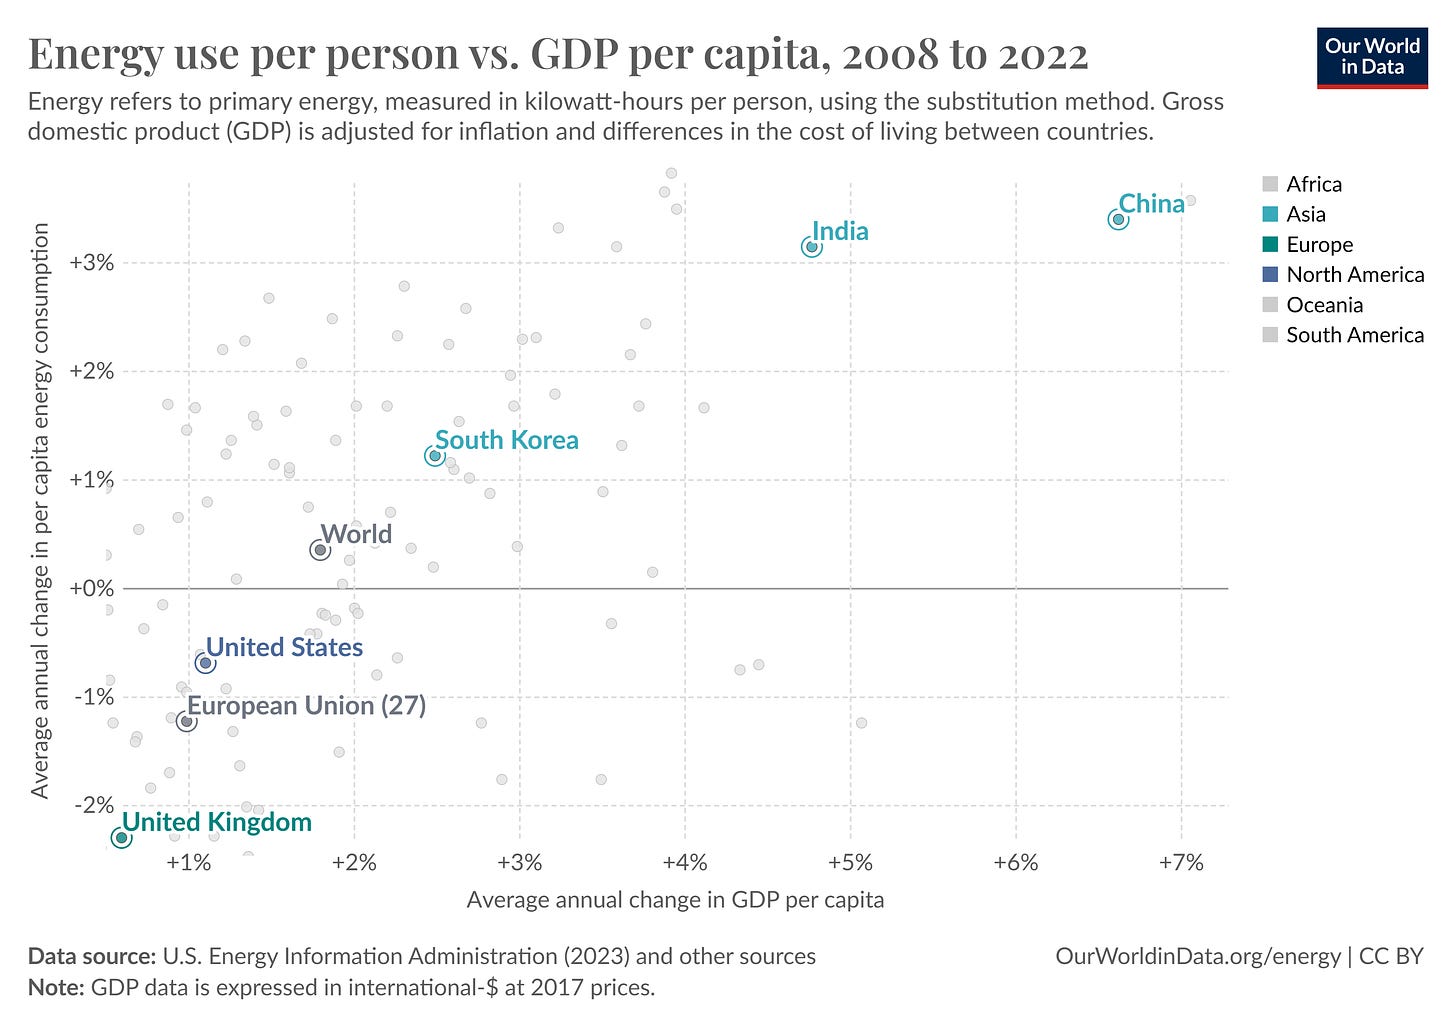
Figure 6 (again using data from OWID) compares energy use per capita to GDP growth per capita and we see a similar picture. Note OWID uses a slightly different baseline for GDP per capita in this chart.
UK energy consumption has shrunk by 2.3% per year since 2008, the year of the Climate Change Act and per capita GDP has virtually stagnated, rising by only 0.6% per year. The EU and US have reduced energy by less than the UK and have grown a little faster. Overall worldwide emissions have grown by 0.35% per year and per capita GDP has gone up 1.8% each year. South Korea, India and China have all increased energy use markedly and their growth rates are far stronger than the UK, EU and US.
Looking at both charts together, there is a clear relationship that demonstrates cutting emissions leads to lower energy consumption that in turn reduces economic growth, making everyone poorer. This is hardly surprising, we have taxed fossil fuels to the tune of about £50bn per year, making them more expensive and subsidised intermittent renewables to such an extent we now have the most expensive electricity in the IEA. Expensive energy acts as a drag on the whole economy. Energy abundance from cheap, dense, portable and flexible hydrocarbons increases economic growth. Energy scarcity from expensive, intermittent renewables reduces growth.
Conclusions
Against the backdrop of the COP meeting arguing about extra funding that is likely to be ineffective, it is strange that the CCC recommended we aim for a cut in emissions of 81% from 1990 levels by 2035. It is even stranger that Prime Minister Starmer should accept that recommendation when his primary mission is supposed to be economic growth. The commitment to even deeper domestic cuts to emissions just as we provide extra funding to others as they increase emissions is going to reduce UK growth even more and make us relatively poorer.
As we saw, the CCC claimed their guidance was informed by “the latest science, technological developments and the UK’s national circumstances.” The circumstances are that we emit only 0.8% of global anthropogenic CO2, our per capita emissions are below the global average, and we suffer from pretty much stagnant economic growth. The debt to GDP ratio is closing in on 100% and we have twin trade and budget deficits. Giving more money away will increase the budget deficit. In addition, NESO has told us we need to spend £260-290bn to just make the grid 95% carbon free by 2030. Obviously, it will cost much more to achieve the draconian emissions cuts targeted for 2035. The evidence is pretty clear that we are in dire circumstances and sending our share of $300bn/year abroad as we continue down the Net Zero path will hurt households and businesses, damage growth and send the Government finances into a death spiral. COP29 may well have been a flop, but Starmer is making the UK cop for the lot.
If you enjoyed this article, please share it with your family, friends and colleagues and sign up to receive more content.


You could send your post to Starmer and Miliband and I’ll wager they would fob you off with their standard boilerplate assertions: https://x.com/FCDOGovUK/status/1839325354789675519.
I remember 10 years ago pointing out to assorted politicians the futility of our unilateral attempt to “tackle climate change” using the same graphs of rising global fossil fuel consumption and emissions, only to be fobbed off every time.
Incidentally, the BBC reported on the breach of the precious 1.5°C limit almost a year ago with no mention of the massive global warming spike caused by the Hunga Tonga undersea volcanic eruption, a concealment of the truth which proves they are lying to us: https://www.bbc.co.uk/news/science-environment-68110310.
Brilliant article which I will share with our local Labour MP and my “Politics in Pubs” group. Btw - if you are ever in Manchester on the 4th Tuesday of the month we would be very happy to have you as a guest speaker. We also have groups in Newcastle, London and Sheffield.