Net Zero watchers cannot have failed to see this story recently:
Britain’s climate watchdog has privately admitted that a number of its key net zero recommendations may have relied on insufficient data, it has been claimed.
Sir Chris Llewellyn Smith, who led a recent Royal Society study on future energy supply, said that the Climate Change Committee only “looked at a single year” of data showing the number of windy days in a year when it made pronouncements on the extent to which the UK could rely on wind and solar farms to meet net zero. [emphasis, links added]
“They have conceded privately that that was a mistake,” Sir Chris said in a presentation seen by this newspaper. In contrast, the Royal Society review examined 37 years’ worth of weather data.
Last week Sir Chris, an emeritus professor and former director of energy research at Oxford University, said that the remarks to which he was referring were made by Chris Stark, the Climate Change Committee’s chief executive.
He said: “Might be best to say that Chris Stark conceded that my comment that the CCC relied on modeling that only uses a single year of weather data … is ‘an entirely valid criticism’.”
Stark has tried to waffle his way out of trouble by issuing a nonsensical and very long winded rebuttal on X, but nobody’s buying it, certainly not Andrew Montford:
Last night, the CCC’s Chief Executive, Chris Stark put out a long Twitter thread addressing these issues. But while it’s dressed up as a rebuttal, it’s nothing of the sort. In fact, it’s a masterpiece of bureaucratic obfuscation.
Recall firstly that this blew up when the Sunday Telegraph reported Sir Christopher Llewellyn Smith’s criticisms of the CCC’s energy system modelling: they had failed to look at the possibility of back-to-back low wind years. This meant that they underestimated the amount of hydrogen storage the system would need, and thus the costs involved.
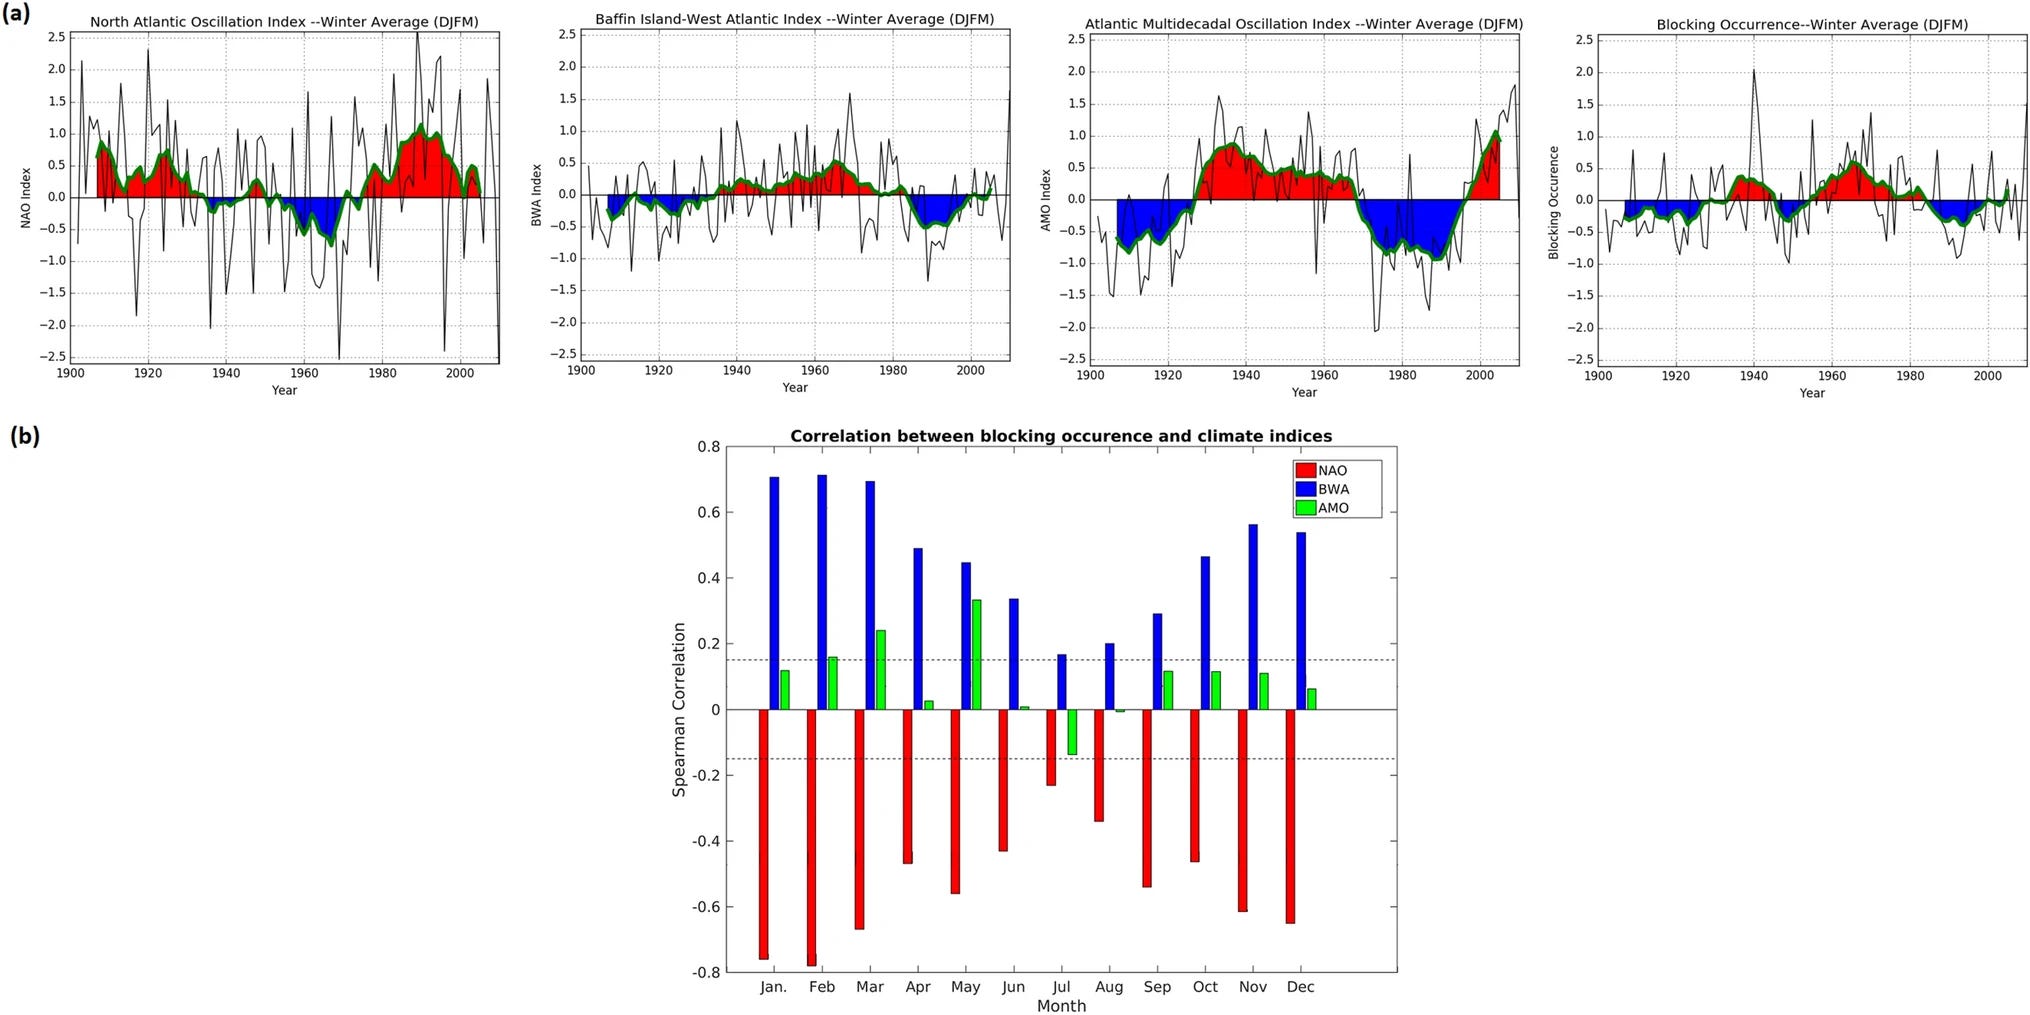
37 years is better than one year for sure. Chris Llewellyn looked at the period 1980-2016 to assess the requirement for hydrogen storage. But even that is not sufficient because it so happens that this period corresponded almost exactly with a positive winter trend in the North Atlantic Oscillation, which itself correlates very strongly with a significant decline in the frequency of winter [DJFM] atmospheric blocking events over the North Atlantic. Less blocking events in winter means on average windier and stormier weather over the north Atlantic and northern Europe. So, by accident or design, the Royal Society just happended to pick a period when winters were windier on average in Europe and the UK due to cyclical natural internal climate variability. Winter is the critical time for generating wind powered electricity because demand is higher and wind speeds are generally greater than in spring and summer.
You can see clearly that if the Royal Society had picked the period 1955-1980 instead, there was a lot more winter atmospheric blocking over the north Atlantic, winters were as a result considerably colder and wind speeds were on average lower, so the Royal Society in that case might have concluded that the need for hydrogen storage would be even greater! Oh dear.
This matters because the Climate Change Committee’s calculations are obvious garbage, being based on one year of wind speeds only. But the Royal Society’s calculations should be taken with a large pinch of salt also for the reasons listed above. It matters because, looking at the above graph, it looks like we are headed into another negative winter NAO period and so winter wind speeds will probably decrease once again, as northern European winters become significantly colder. With the rush to build increasing reliance on offshore and onshore wind to power the grid, this could spell complete disaster.
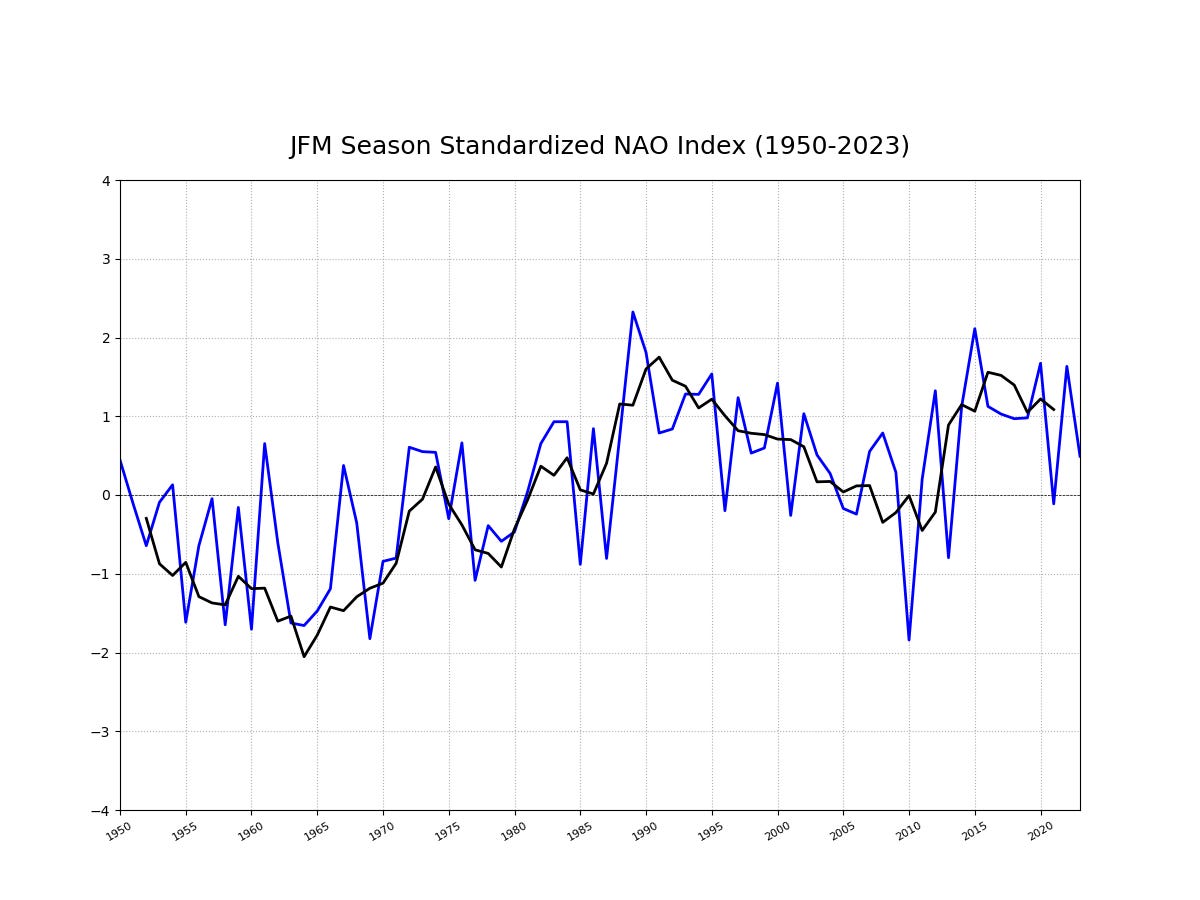
Here’s NOAA’s graph of standardized NAO winter (JFM) index. You can clearly see the trough which occurred during the 60s and 70s plus the marked decline in 2009/10, when winters got very cold in northern Europe. It climbed back up after that, but it seems quite likely that we are now headed downwards, perhaps for the next few decades, as happened during 1955-1980.


