How Net Zero Damages Growth
The key to higher productivity, more investment and faster growth is cheap energy
Summary
The UK Chancellor, Jeremy Hunt has recently set out his plans to support faster economic growth using the four Es – Enterprise, Education, Employment and Everywhere. Unfortunately, he made no mention of the fifth E, cheap Energy. His speech comes in the wake of the lacklustre performance of the UK economy in recent years. The UK was a productivity leader up to 2008 but more recently has become a productivity laggard. Commentators have suggested the UK is lagging because of low investment, poor skills or because UK workers are idlers.
However, there is a strong correlation between high energy prices and low productivity growth among developed economies. How might high energy prices and net zero policies be affecting the UK economy?
Generally speaking, productive industries have higher Gross Value Added (GVA) per hour worked than services or construction. In particular, energy intensive industries and oil and gas production are high productivity industries that have grown much more slowly than the whole economy. Other sectors such as education and healthcare have grown much faster than the overall economy but suffer from low productivity. Productive industries are also highly investment intensive and low growth in these industries has stifled investment. It shouldn’t be surprising that productivity growth is lagging if high productivity industries are growing slowly.
High energy prices and broader net zero policies act as a brake on the economy in general and lead to slow growth or outright shrinkage of energy intensive industries and oil and gas production. This is damaging productivity, investment, energy security and wider economic security.
To turn things around we must focus on the fifth E: cheap energy means faster growth. Domestically produced gas will have a smaller carbon footprint than imported LNG. If the Chancellor is serious about growth, he must lift the ban on fracking and speed up exploration and development in the North Sea by ending the windfall tax on oil companies.
Introduction - UK Productivity Lagging
Many have spoken of the UK Productivity puzzle. They are referring to UK productivity lagging many advanced economies since around 2008. This is shown in data from the OECD (GDP per hour worked USD constant prices, 2015 PPP). Figure 1 shows the UK near the top of the pack from 1997-2008.
Figure 2 shows data from the same source from 2008-2021. As can be seen the UK has moved from a leader to a laggard.
A number of organisations have speculated about the cause of this sudden switch. The National Institute of Economic and Social Research (NIESR) have linked the UK’s sluggish productivity growth to the Great Financial Crisis (GFC). They advocate tackling structural problems in the economy including over-centralisation, weak and ineffective institutions, short-termism and poor policy coordination. However, the US arguably suffered more during the GFC and is still the productivity leader. The Eurozone suffered the GFC and its own sovereign debt crisis. It therefore seems unlikely that the GFC is the cause of the UK’s relative decline in productivity.
PwC focused on comparing the industrial structure of the UK to Germany, France and Sweden and the differences in productivity by sector. They called for higher investment and a stronger education and skills strategy. As we shall see below, they are probably right about investment, but probably for different reasons.
The LSE blamed “institutional features of the British model of capitalism”. Former PM, Liz Truss has stated that “the British are among the worst idlers in the world” and that British workers needed “more graft” and lacked the “skill and application” of foreign rivals”.
Very few, if any, analysts have considered the impact of high energy prices and net zero policies on productivity growth. This is odd because another big event happened in 2008: the introduction of the Climate Change Act (CCA). The CCA originally sought to reduce UK CO2 emissions by 60% from 1990 levels by 2050. Since then, the scale of ambition has increased and the target is now Net Zero by 2050. This article looks at the role net zero policies have played in creating the UK’s productivity problem and the impact on the wider economy and society.
High Energy Prices Correlated to Low Productivity Growth
As was discussed in an earlier article, net zero policies have driven the growth of renewables that in turn have pushed up electricity prices. There is a strong inverse relationship between energy costs and productivity growth. The combination of the OECD data used in Figure 2 above with the BEIS international industrial electricity costs (Table 5.3.1) used in the earlier article linked above is shown in Figure 3.

The electricity prices used are 2021 values from the BEIS data except for Italy (2019) and New Zealand (2020) which are the latest available figures. New Zealand was used because Australian price data was not available and it was thought important to use a non-US, non-EU developed economy in the analysis.
The chart shows that higher electricity prices are correlated with weaker productivity growth. The correlation is strong, with an R2 =0.7, which certainly warrants further investigation.
This finding is borne out by the correlation between slower economic growth and higher CO2 emissions cuts.
UK Productivity by Industry Sector
The ONS produces comprehensive statistics on the productivity of the UK economy with the data broken down between industrial sectors. Productivity is measured as Gross Value Added (GVA) per hour worked. The economy is broken down into sectors by a classification scheme. At the top level there is the Whole Economy that is divided into three main industries: Production, Construction and Services. Each of those industries is broken down into sections and divisions according to SIC-code classifications. The ONS has collated data for GVA, hours worked and output per hour at the division level since 1997.
At the top level, Services have grown faster than the economy as a whole. They grew from a 72.9% share in 1997 to nearly 80% in 2021. Construction grew from 4.8% to 5.9% and Productive Industries fell from 22.3% to 14.3%. Figure 4 below shows how the share of the economy has changed over time with the 1997 share indexed at 100.
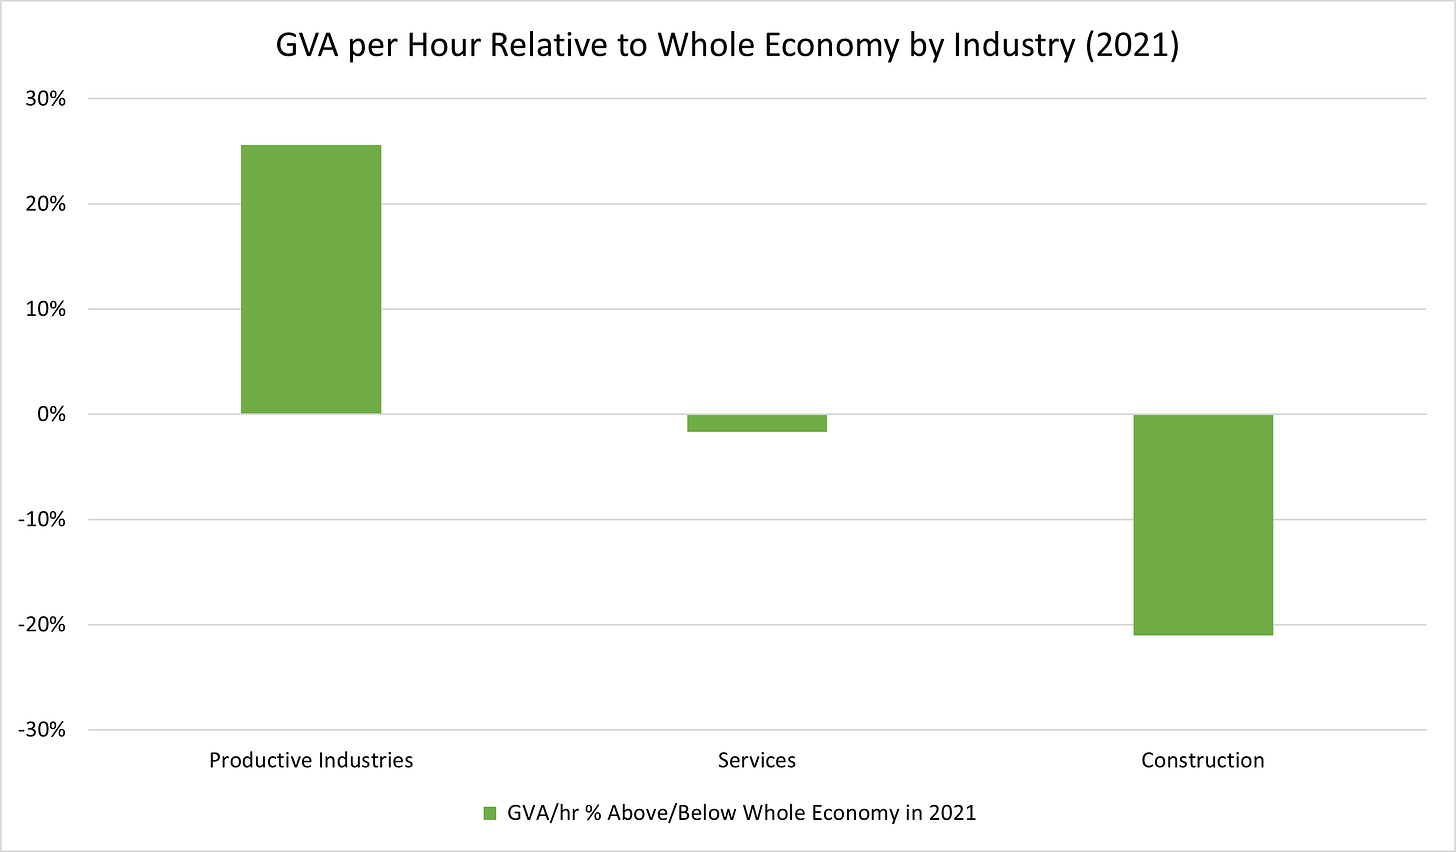
Clearly, the economy is continuing the transition away from productive industries towards services. The trouble is, with some notable exceptions, services and construction have lower productivity than productive industries as shown in Figure 5.
Clearly, if high productivity industries are shrinking as a proportion of the economy at the expense of lower productivity industries, then overall productivity growth is going to suffer.
Going into more detail, it is possible to compare the growth rate and productivity of different sections and divisions of the economy as shown in Figure 6 below.
The vertical axis shows the productivity (GVA/hr) of a number of selected industry divisions and sectors relative to the whole economy in 2021. The horizontal axis shows GVA growth of each sector relative to the whole economy from 1997-2021. The vertical axis is shown on a log-scale because some industry divisions are very much more productive than the economy as a whole. For instance, Mining and Extraction is 361% more productive than the whole economy.
As can be seen from the chart, productive industries are more productive than the economy as whole (126% of the whole economy) but have grown at a rate of 39% of the whole economy. Service industries are slightly less productive than the economy as a whole (98%) but have grown faster (116% of the whole economy). Construction is less productive than the whole economy (79%) yet has grown at a rate of 140% of the whole economy.
The chart has been divided into 4 segments. The green segment is High-Growth/High Productivity and includes Financial Services and Information and Telecommunications (including Film and TV Production and Broadcasting). Clearly, we should be doing all we can to encourage these industries to flourish.
The yellow segment is High-Growth/Low-Productivity sectors. This includes areas such as Education and Healthcare that are largely Government run. The massive growth in the Education sector belies the claim that lack of skills are the underlying cause of the productivity problem. Unless, of course, people are not learning skills that are useful in the workplace. The Construction and Professional, Scientific and Technical sectors are also included in this segment. In another article we might ask what can be done to improve the productivity of these sectors.
The white segment is Low-Growth/Low Productivity sectors that include the wholesale and retail industries.
Most worrying is the red segment that shows Low-Growth/High Productivity sectors. This includes almost exclusively the different productive industries such as Mining and Extraction (including Oil and Gas production) and Energy Intensive Industries. As can be seen, the mining and extraction sector has grown only very slowly, at a rate of only 5% of the whole economy. Yet, it is one of the most productive sectors. Energy intensive industries have also grown much slower than the whole economy (35% of the rate) but are much more productive than the rest of the economy.
It shouldn’t be a surprise that overall productivity growth is sluggish if our most productive industries are growing much more slowly than the whole economy and our least productive industries are growing much faster. If we are to restore the productivity performance of the whole economy, we need to find a way of growing these highly productive industries more quickly.
UK Investment by Industry Sector
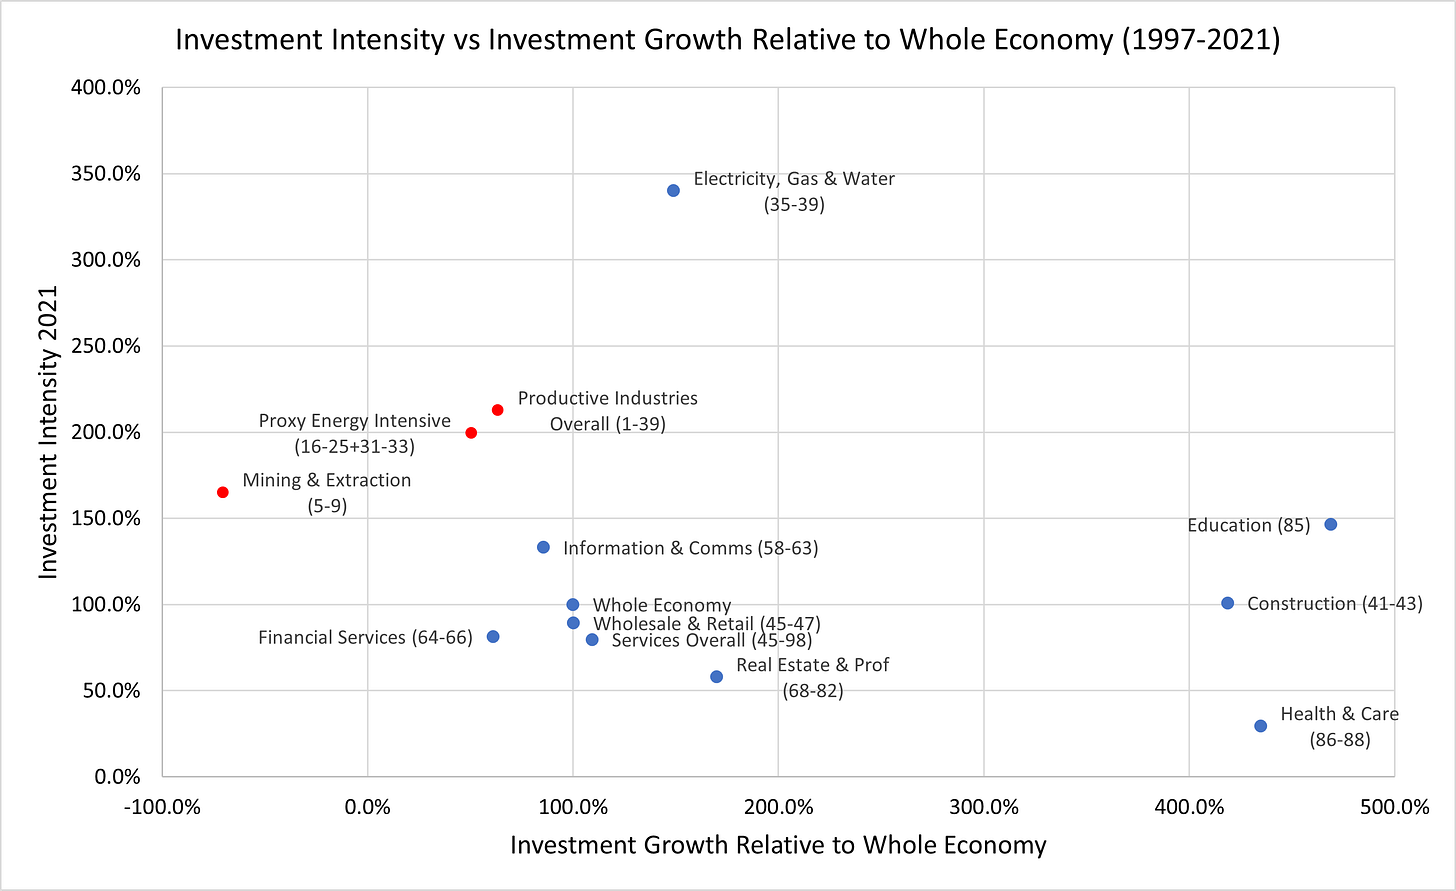
The relative decline in productive industries has had an impact on levels of investment. The ONS publishes investment statistics by industry. This data has been combined with the productivity statistics to compare investment intensity (investment/GVA) to investment growth for selected industry sectors in Figure 7 below.
From this data it can be seen that investment in the Mining and Extraction sector has fallen in absolute terms between 1997 and 2021 yet is one of the most investment intensive sectors.
Productive Industries Overall and Energy Intensive industries have also suffered slower investment growth than the rest of the economy and their investment intensity is also much higher than average.
As highlighted in the Introduction, some commentators have claimed that the productivity problem is caused by a lack of investment. To some extent they may be right. However, it is not surprising that overall investment levels are weak if the most investment intensive industries are in relative decline or even shrinking in absolute terms. Time to look in more detail at these industries and how Net Zero policies have contributed to their decline.
Extractive Industries Very Productive
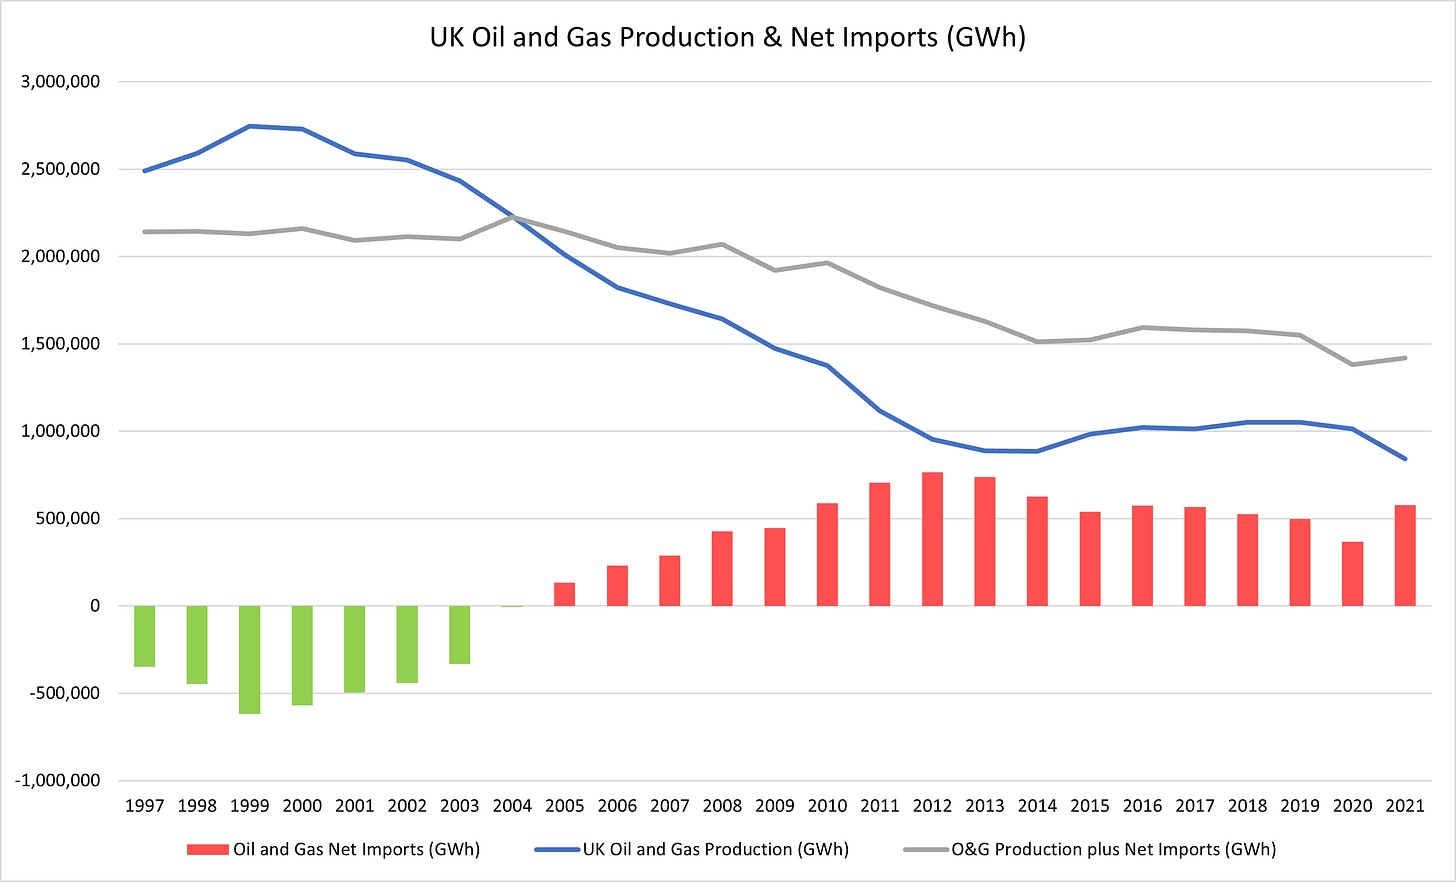
As a reminder, the extractive industries are one of the most productive sectors of the economy, with GVA/hour some 361% of the economy as a whole. The Government publishes statistics about oil and gas production and consumption. Statistics on oil production and imports can be found in DUKES Table 3.1.1 and gas statistics are published by BEIS. After converting the figures to GWh we can see how overall oil and gas production and net imports have change over time in Figure 8 below.
Overall oil and gas production has fallen significantly, but usage (production plus net imports) has fallen less dramatically. There is no sign that demand for oil and gas is going to drop to zero any time soon. The UK has been a net importer of oil and gas since 2005. Of course, this has a negative impact on the trade deficit. As can be seen in Figure 9 below, investment has plummeted in recent years meaning current production is unlikely to be replaced by new developments leading to increased imports.
On the one hand, it might be expected that the Oil and Gas sector would shrink as the North Sea went into decline. However, Net Zero policies have exacerbated this problem in a number of ways.
1. Recent Governments have discouraged oil and gas exploration in the North Sea by delaying approval of new developments such as Cambo and Jackdaw.
2. The recent announcements to impose windfall taxes on oil and gas companies have caused a number of companies to reconsider their investments in the North Sea. Shell is reviewing £25bn of investment in UK energy; Equinor is evaluating impact of windfall taxes on projects; TotalEnergies is to cut UK investment by 25% and Harbour Energy has opted out of new drilling because of the windfall tax.
3. The 2019 moratorium on fracking effectively blocked new investment to exploit new natural gas resources under our feet.
More recently, the Labour Party has announced that if it gets into power, it will not allow any new investment in the North Sea.
It does seem rather odd to bemoan slow productivity growth and low investment in the UK at the same time as demonising and stifling development of one of the most productive and investment intensive industries.
To do this in the name of Net Zero when imported LNG has a larger carbon footprint than domestically produced gas is doubly alarming. LNG has to be cooled and compressed then shipped thousands of miles on fossil-fuel guzzling ships, where some of it boils off and then re-gasified when it reaches our shores.
In addition, relying on more imports of oil and gas as we let domestic production dwindle will make us more dependent on other countries, damaging energy security.
Energy Intensive Industries Very Productive
Energy intensive industries include the manufacture of wood, chemicals, pharmaceuticals, steel, fertiliser, petrochemicals, plastics and other metals. All are essential to modern, developed economies. As can be seen in Figures 6 and 7, these industries have seen GVA and investment growth lower than the whole economy. Figure 10 shows how hours worked in the sector have fallen as the industrial electricity price has risen since 2008.
By definition, energy costs are a very large part of the cost base of these industries. High electricity prices driven by the high cost of renewables and net zero polices are bound to curtail investment and growth.
High energy prices also have an impact on wider economic security:
· CF Fertilisers halted production at their plant that produces ~40% of UK needs for nitrogen fertiliser, vital for food production.
· UK steel production has fallen rapidly since 2015, with high energy costs cited as a reason in a recent Commons Library report.
· Petrochemicals giant Ineos has warned that continued high energy costs threaten domestic production.
All of these products are vital to the functioning of a modern economy. Loss of domestic production increases the trade deficit and damages economic security.
Conclusions and Recommendations
The goals of policy ought to include:
Becoming a high-productivity/high growth economy
Improving levels of productive investment
Ensuring a high level of energy security
Improving broader indicators of economic security such as food security and maintaining strategic capabilities in vital industries
If we are to find ways of improving productivity and investment in the UK economy, we must look to grow high-productivity/low-growth sectors. The fifth E, cheap energy is critical to this objective. Productivity and investment in the productive industries can only be improved by lower energy prices. Increasing supply of energy will reduce prices. Domestic sources of supply have a smaller carbon footprint than imports and more domestic supply means greater energy security. This means Net Zero policies should be changed to:
Stop demonising the fossil fuel industry, by encouraging more exploration and development in the North Sea. This means ending the crippling windfall tax and speeding up approval processes.
End the moratorium on fracking for gas in shale deposits to increase gas supply.
If you enjoyed this article, please share it with your family, friends and colleagues.


Great article bringing some new insight into the productivity-growth debate. I can't for one moment imagine that our 'Masters' will be interested in such because they are on a path (to destruction) that they can't get off - it will require them to confess their errors. We need a new generation of 'Masters' which I reckon is 10 - 20yrs away, so I think we'll have tighten our belts in the mean time.
I work in the water sector which has come under constant criticism from the Regulator for slow productivity growth. I've put it down to more oppressive regulation (which I'm sure it is) but your article brings further insight. Water company costs (across 5yr investment cycles) are split roughly 50/50 between opex and capex (although the capex is obvs depreciated) and the slow productivity growth in construction (which is my specialism) will have a big impact as well.
Water companies can and do produce their own green energy but in the 100 or so projects I've been involved in not one would have received shareholder funding were it not for the tax bung (transfer of wealth from poor to shareholders). These projects provide some energy resilience for the company and customers but they don't save them money.