Material Intensity of Electricity Generation Technologies
New work from Breakthrough Institute, although flawed, moves on the debate
Introduction
The material intensity of different electricity generation technologies is a hotly contested debate. There are many studies that have analysed this topic, for instance the US Department of Energy (DoE) and the UNECE. However, technology is continuously improving and the Breakthrough Institute has recently produced a new analysis with up-to-date figures.
This article recaps the findings of the DoE and takes an in depth look at the new Breakthrough Institute paper to identify anomalies.
US DoE Quadrennial Technology Review
Although billed as the quadrennial review, it appears that the last report was produced in 2015. Of course, that report will have used data from an earlier period, so by now is well out of date.
The Breakthrough Institute reproduce a chart using the US DoE data that is shown in Figure 1 below.
This shows total mineral requirements of over 16,000 tons/TWh for solar power and over 10,000 tons/TWh for wind power with nuclear at 920 tons/TWh. Note that tons/TWh is approximately equal to the kg/GWh units used below.
The UNECE paper referred to above does not include steel and concrete in its analysis, so is not comparable to either the US DoE or the Breakthrough Institute work.
New Breakthrough Institute Analysis
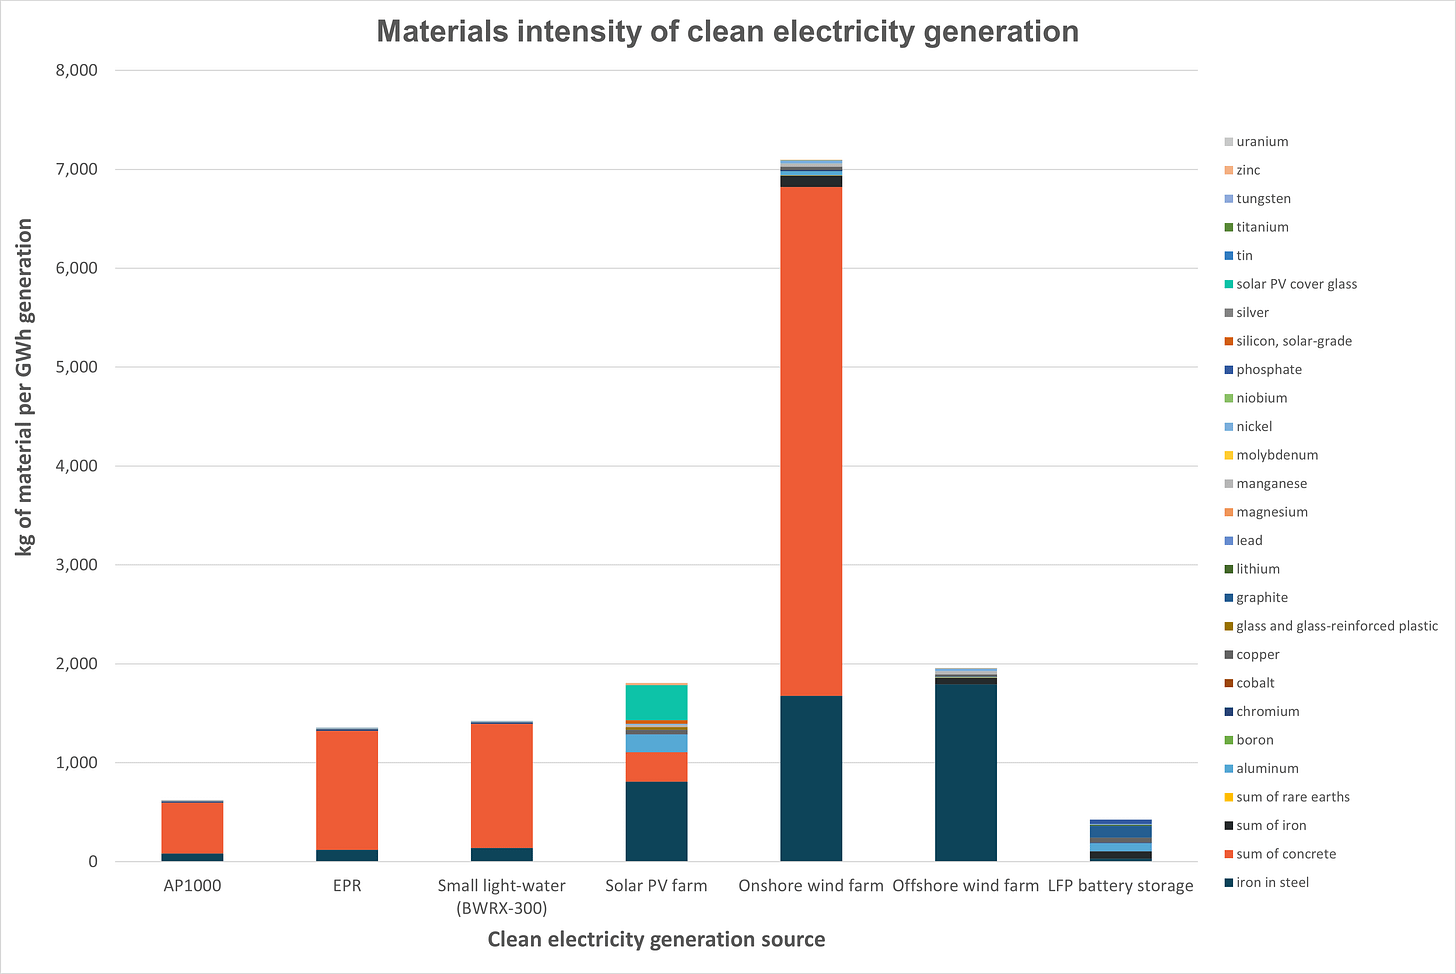
The Breakthrough Institute analysis uses updated data and shows improvements for wind, solar and nuclear compared to the DoE analysis as shown in Figure 2 below.

Solar power shows the biggest improvement of 89% with material intensity falling to just over 1,800 kg/GWh. Assuming the DoE analysis was for onshore wind, this has improved 31% to almost 7,100 kg/GWh.
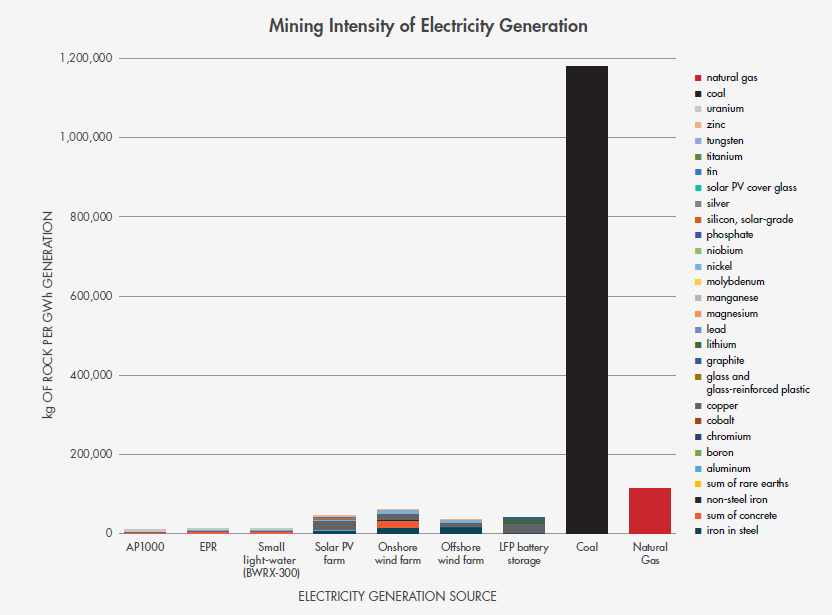
The Breakthrough Institute has also analysed how much rock must be moved to produce the mineral required for each energy source and their chart is reproduced in Figure 3 below.
In this chart they also show coal and natural gas. As can be seen, coal is virtually off the charts and the low carbon technologies pale into insignificance. Their treatment of natural gas though is somewhat suspect. The 120,000 kg of “rock” per GWh refers to the mass of gas used to produce a GWh of electricity. This is somewhat disingenuous because gas is not rock and relatively little rock is removed in the process of drilling a gas well.
Breakthrough Institute Assumptions
No doubt there have been some technological improvements since before 2015. However, the improvements in mineral intensity for wind and solar are considerable, so what has driven these improvements? It takes some delving into their data sheets to work out how they have calculated their results.
For solar power, they have assumed a capacity factor of 24% and an asset life of 30 years. While such a high capacity-factor might be achievable in Texas for instance, in the UK we achieved an average of only 10.5% in the past five years. For onshore wind, they have assumed 35% and 25 years and for offshore wind 55% and 30 years. The DoE did not disclose their equivalent assumptions, but they are well in excess of what is being achieved in practice in the UK. We achieved five-year average capacity-factors of 26% for onshore wind and 41% for offshore.
Moreover, feed-in-tariff and renewables obligation only last for only 20 years with contracts for difference lasting only 15 years. It is unlikely that grid-scale power plants would be commercially viable without subsidy, so the asset lives should be curbed accordingly.
Assuming high capacity-factors and long asset lives pushes up the lifetime generation of these technologies and so reduce the mineral intensity per GWh.
It is also noteworthy that they assume a relatively low capacity factor of 85% for nuclear and a short asset life of 60 years, especially when one considers that the US has granted life extensions to 80 years for some existing plants.
Adjusted Mineral Intensity
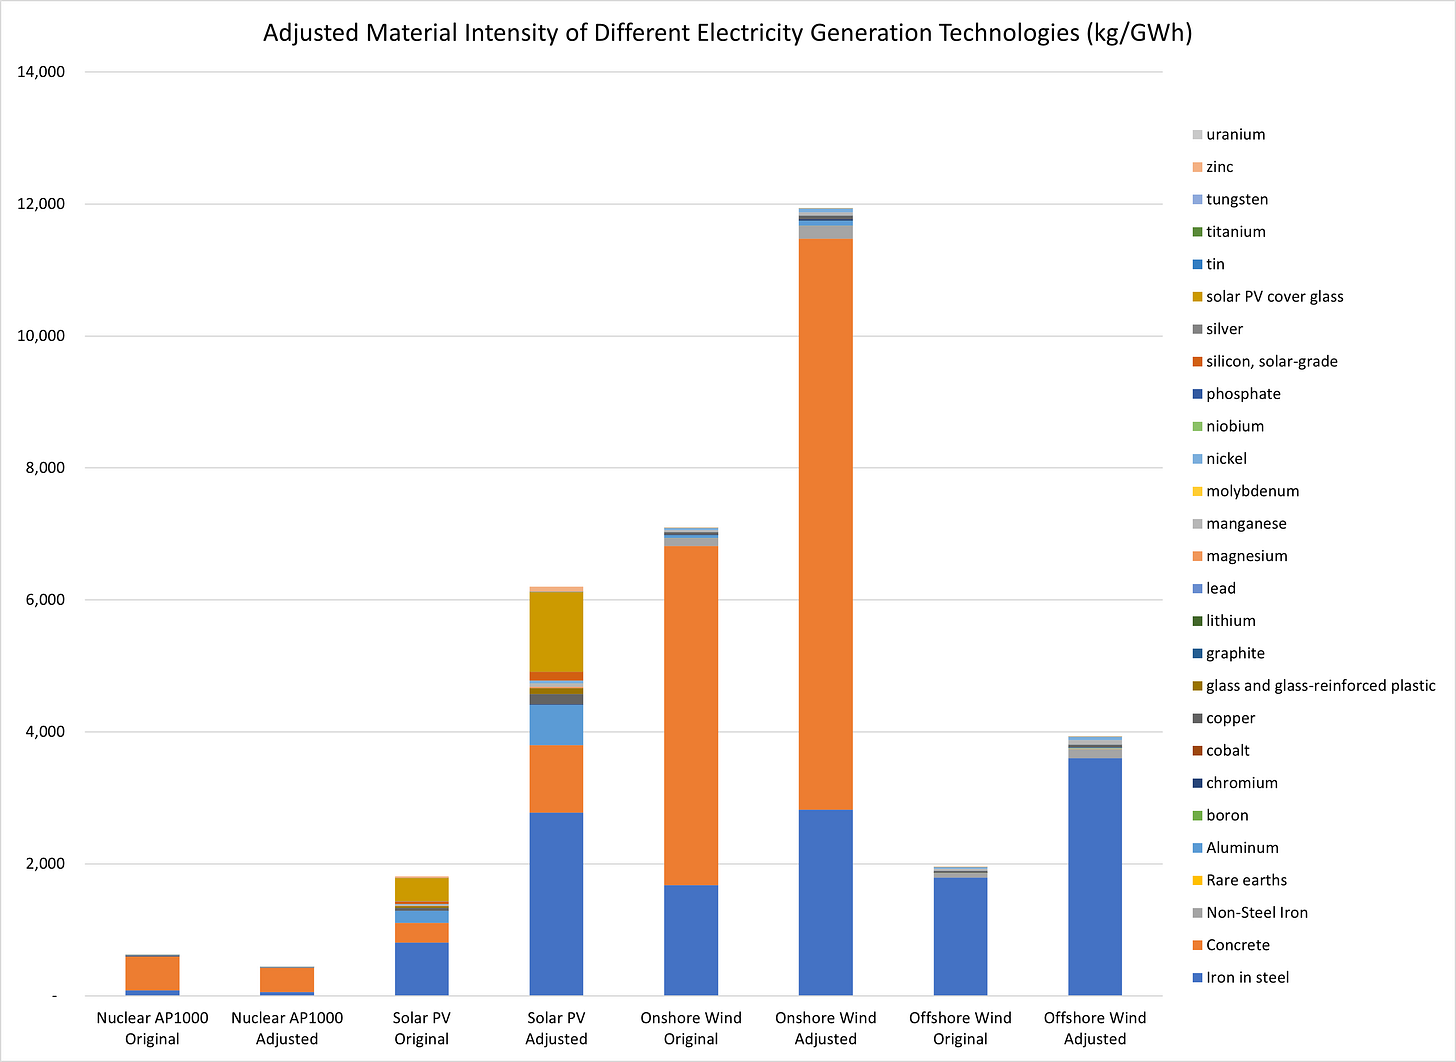
Figure 4 compares the Breakthrough Institutes results with the results obtained after adjusting wind and solar capacity factors to UK averages and the asset life to 20 years. Nuclear power has been adjusted to a 90% capacity factor and 80-year asset life.

The material intensity for nuclear falls 29%, while the material intensity for solar goes up 243% to 6,201 kg/GWh and that for onshore wind increase 68% to 11,935 kg/GWh and offshore rises 101% to 3,930 kg/GWh. Solar is still much better than the DoE figures, but onshore wind is worse.
Impact of Battery Storage
We saw in Figure 2 above that the Breakthrough Institute also considered the material intensity of Lithium Ferro-Phosphate (LFP) batteries. However, their analysis is somewhat flawed.
First, their chart says they assume a 2GWh battery charging and discharging by 1GWh per day over a 25-year life which would be 9,125GWh discharged to the grid over the lifetime. However, their Excel model shows 18,250 discharged to the grid over the lifetime, or 2GWh per day. Moreover, if one considers charging and discharging losses, the battery makes a net negative contribution to the grid because it consumes energy as it charges.
Second, they effectively assume the batteries are standalone and not part of a wider system. In reality, a certain level of battery storage will be required by a solar or windfarm to scavenge electricity at times of peak supply when demand is low and return it to the grid when supply is low and demand is high. The material required for this battery must then be added to the material requirements of the wind or solar farm to calculate the “buffered” material requirement for those technologies.
Third the expected life of an LFP battery is 5-10 years or 3,000-5,000 charge cycles. Over the lifetime of the wind or solar farm, we would expect that the battery needs to be replaced at least once.
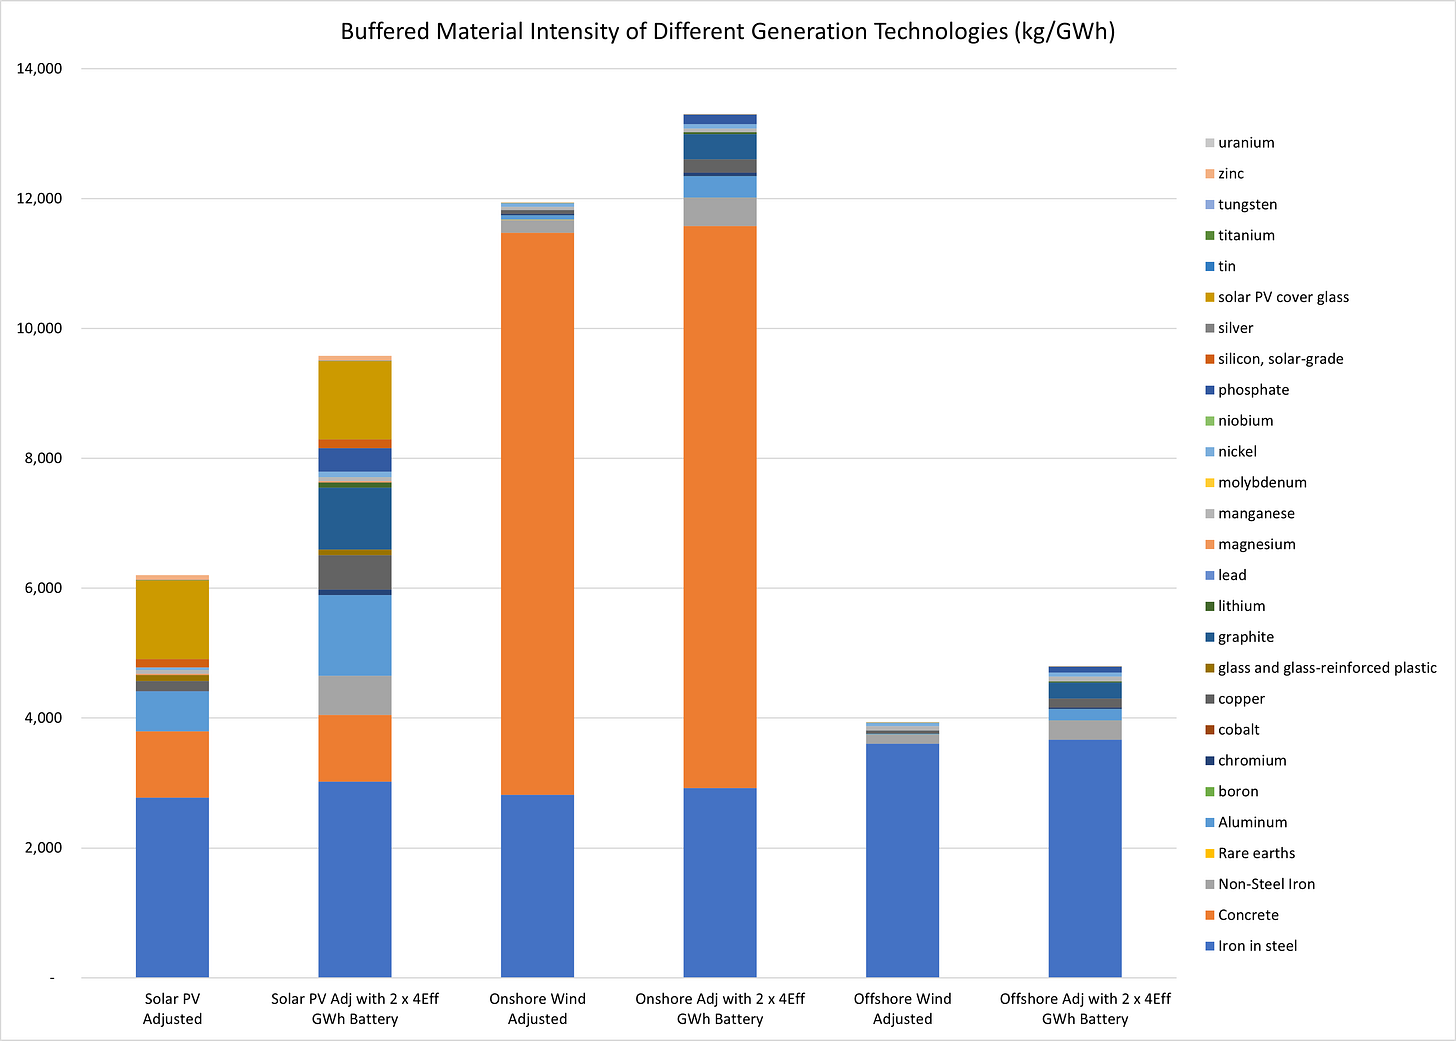
If we assume that each wind and solar farm requires four of these 2GWh nominally sized batteries, each giving 1GWh per day (1GWh effective capacity), or 4GWh in total at a rate of 0.5GW over eight hours each day, and each battery needs replacing after 10 years, we get the “buffered” mineral intensity shown in Figure 5 below.

The buffered material intensity of solar goes up 54% to 9,581 kg/GWh. Onshore wind increases 11% to 13,300 kg/GWh and offshore wind rises 22% to 4,796 kg/GWh.
At UK latitudes, to maintain a steady output for solar power would require an enormous battery because of the massive inter-seasonal differences in generation. In practice, wind power would also require an enormous battery because sometimes we can go for days with negligible wind generation. However, the material intensity would then go off the charts. This is why batteries can only be considered for very short-term storage and we have not yet solved the long duration storage problem.
Conclusions
As we have seen, the mineral intensity of different electricity generation technologies is extremely sensitive to the assumptions made during the calculations. Moreover, the output of solar farms in particular is highly sensitive to latitude. Tropical latitudes can achieve the capacity factors assumed by the Breakthrough Institute. However, in more temperate latitudes like the UK, then capacity factors are much lower. Any calculation of the material intensity of solar power should show different values for a range of latitudes.
The material intensity of wind power is also very sensitive to load factor and asset life. We must use realistic assumptions if we are to calculate results that are meaningful in the real world.
The whole subject of the amount of storage required to mitigate the intermittency of wind and solar power is under-analysed. However, it is more sensible to add the minerals required for the batteries to those of the generation technology than to treat batteries as standalone entities.
My clear conclusion from this is that nuclear and gas have the smallest material intensity and if we really care about the total environment, then these technologies should be our focus.
The podcast version of this article can be found on these links to Spotify, Apple and YouTube.
If you enjoyed this article, please share it with your family, friends and colleagues and sign up to receive more content.


Excellent, as usual, David. There are still way to many who believe VRE are the cheapest form of generation and provide the lightest touch to our planet.
Any why wouldn’t they? Too many powerful and influential people repeat ad nauseum the inexpensive VRE canard, and are rarely challenged.
Until there is a critical mass of people realizing that we cannot completely power our world with non-dispatchable sources, and thermal generation of some type will likely always be needed until a new generator that has not yet been conceptualized comes along.
It seems like no governments here in the West are realising the power that nuclear holds. We're too busy pouring money into solar and wind. The UK government has invested over 1.3 billion pounds into solar and wind compared to the 300 million into nuclear. While the 300 million is the most they've invested in the past 70 years... it's not enough, especially with all that money going to wind and solar.
China recently opened a Thorium Molten Salt reactor and are planning to open 150 more nuclear plants between now and 2035... we're falling so far behind. Add to this industrial powerhouses like Germany closed down their last 3 plants in April 2023 to then rely on gas from Russia.. and we all know what happened there.
It seems to me like there's very little thought process behind anything. Why would anyone want their grid running on something that only generates electricity when the conditions are just right? You'll always be relying on something else, whether that is fossil fuels or nuclear to fill in the gaps in energy.
This is without mentioning how much a large scale electrical grid battery system would cost... only to last a couple of years...